Increase of global mean Earth’s surface temperature due to doubling of CO2 estimated to be marginal.
Guest contribution by Frans van den Beemt
Abstract
The aim of this study is to get an order of magnitude value for the increase of the Earth surface temperature at doubling CO2 concentration from 300 ppm to 600 ppm (parts per million). Here an original method is worked out that complements an earlier original study with the same aim [i]. The warming effect of higher concentrations of CO2 appears to decrease exponentially and has largely lost its effect above 100 ppm, so it is not surprising that the atmosphere at a CO2 doubling from 300 ppm to 600 ppm only emits 1 Wm-2 less energy to space and that the temperature at the Earth’s surface could increase by no more than 0.2 Celsius or in theory, would not even increase at all.
Nederlandse samenvatting
Het doel van deze studie is om de invloed van verdubbeling van de CO2 concentratie van 300 ppm naar 600 ppm (parts per million) in de aardse atmosfeer op de temperatuur van het aardoppervlak te bepalen. Dit alleen voor een fictieve globale gemiddelde aarde inclusief wolken. In een eerdere studie[i] is dat gedaan door met fysische formules een bovengrens te bepalen voor de infrarood (warmtestraling) absorptie door CO2. Het opwarmend effect van hogere concentraties CO2 blijkt exponentieel af te nemen en heeft zijn werking boven 100 ppm al grotendeels verloren, zodat het niet verwonderlijk is dat de atmosfeer bij een CO2 verdubbeling van 300 ppm naar 600 ppm slechts 1 Wm-2 energie minder uitstraalt naar de ruimte en de temperatuur aan het aardoppervlak maximaal 0,2 Celsius kan stijgen of in theorie zelfs wellicht niet zal stijgen.
INTRODUCTION
The aim of this study is to get an order of magnitude value for the increase of the Earth surface temperature at doubling the CO2 concentration from 300 ppm to 600 ppm. Here an original method is used that complements an earlier original study with the same objective [i].
For calculating the cooling of the Earth by infra-red radiation emission to space at increasing CO2 concentrations a commonly used computer program MODTRAN [v] is used. It is free available at the website of the University Chicago [iv]. MODTRAN calculates the infra-red emission from CO2 gas line by line in a given Earth atmosphere model using the 1976 U.S. Standard Atmosphere. Calculations are restricted to global mean values in combination with frequently re-measured data as found in the literature [ii]. An earlier study calculated an upper limit for the infra-red absorption by CO2 within the troposphere without using any specialized computer model [i]. Now a different method based on emissions is used to quantify the role of CO2 in the atmosphere.
CALCULATION AND RESULTS IN A NUTSHELL
“Greenhouse” gases like H2O and CO2 absorb and emit infra-red radiation in wavelengths that correspond to their molecular vibration and rotations. These specific wavelengths are known very well. Part of the CO2 wavelengths shows strong overlap with H2O wavelengths, except for the region of 15 μm, where the overlap is very minor. This 15 μm band contributes strongly and almost independently from H2O to the overall infra-red emission to space. MODTRAN calculates the overall radiation (energy) emission from the Earth surface and atmosphere to space for a given composition of the atmosphere. Furthermore, 78.7% of the total by MODTRAN calculated emission, corresponds with the specific CO2 15 μm band.
At CO2 concentrations above 100 ppm, CO2 central-band emission directly to space originates in the lower stratosphere at very low temperatures of around 220K and low enough CO2 densities. At increasing CO2 concentration the direct emission to space shifts to a higher altitude with increasing temperatures caused by the Ozone layer.
Besides the central-band emission, we have the emissions of the side lobes. The central band is emitting radiation due to single vibrating and rotating molecules. But the edges (side-bands or side lobes) of that central CO2 15 µm band is emitting from vibrating and rotating double or triple molecules in the short moments, that they are close enough together that they can influence each other.
These emissions are known as collision broadening spectra lines. Sufficient density of these multiple molecule energy states to emit to space are found near the surface in the first few km altitudes. At increasing CO2 concentrations direct emission to space takes place from some higher altitude in the troposphere at lower temperatures. These side-lobe-band emissions are in fact the only parts of the 15 µm CO2 band that show a warming effect by decreasing infra-red emission to space at increasing CO2 concentrations above 100 ppm. while clouds absorb all emissions at CO2 specific wavelengths, infra-red emission to space from CO2 molecules from beneath these clouds is not possible. Therefore, the global mean cloudiness of 62% [ii] causes a reduction of the effectiveness of the CO2 side-bands infra-red emissions-to-space to 38%.
As we need to know the decrease in infra-red emissions purely caused by doubling of the CO2 concentrations and not emissions from parts of the CO2 spectrum that in the real atmosphere have an overlap with emissions that originate from other infra-red active gases as H2O vapor or clouds. Hence, the total correction (15 µm band and clouds) on the emission results, as calculated by MODTRAN, becomes 78.7%*38%=29.9%.
In summary, at increasing CO2 concentrations, the central-band will emit at a higher temperature and the side-bands at lower temperatures. The net emission effect (Δemission) is calculated using MODTRAN for 300 ppm, 600 ppm, and 1000 ppm (see the results in Table 5).
The earth surface emits infra-red radiation with energy set by the formula ɛ.σ.Te4 and an increase of the surface temperature ΔTs as a direct result of an increase of the CO2 concentration from 300ppm to 600ppm is calculated with the formula:
Δ-emission=ɛ.σ.{(Ts+ΔTs)4 – Ts4}
CALCULATION AND RESULTS IN DETAIL
The following global mean factors are used:
-A global mean surface temperature Ts of 288.2K,
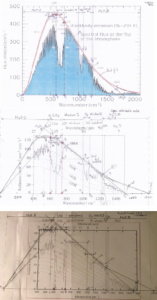
Figure 1. Manually measuring three satellite absorption spectral graphs.
-The 1976 U.S. Standard atmosphere,
-An average global cloud cover (cloudiness) of 62% [ii],
-Emissivity, ɛ=0.9721 (derived from the difference between MODTRAN calculation and blackbody calculation and in line with water (average ɛ=0.995) and sand (average ɛ=0.955),
-Stefan-Boltzmann constant σ= 5.67 * 10^-8 W m-2 K-4
The infra-red (IR) active gases and clouds together shield off most of the emission of the surface to space directly. Only a small window (32% measured by satellites) of IR wavelengths emits directly from surface (288.2K) to space [ii]. Further emissions come from the atmosphere from cold cloud tops and from the atmospheric layers at different low temperatures to space.
The first 300 ppm CO2 in the atmosphere of the Earth will shield (absorb) some emission from the surface that will not reach space. The 15µm spectral lines that originate from single CO2 molecules contribute to IR emissions to space, originating from several different atmospheric altitudes and temperatures. For the CO2 15µm central lines this happens at the approximately 222K beginning at lower stratosphere and for its side-lobes, it happens between approximately 222K and 288K in the lower troposphere. These effective emitting temperatures can be read from Planck curves in satellite absorption spectra graphs but also from spectra graphs generated by MODTRAN. At 300 ppm and 600 ppm CO2 respectively, MODTRAN shows a central line emission temperature of respectively 222K and 225K that increases further with higher CO2 concentrations.
From these satellite absorption spectra graphs, it can be measured manually what percentage of emission energy under the Planck curve belongs to the specific 614 cm-1 – 723 cm-1 CO2 15µm band[i] in which the central band and the two not-yet-saturated CO2 side-lobes are included. The average of three manually measured satellite absorption spectra (Ts around 300K) shows a CO2 15 µm energy fraction f=15.3% of the total spectra emission energy between 0 cm-1 – 1800 cm-1. See fig 1 and Table 1. At the end of this study, Table 6 provides a sensitivity test for this fraction f=0.153.
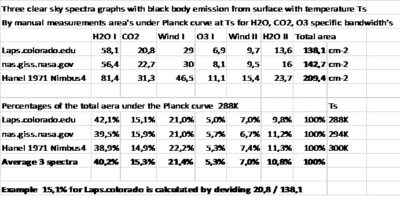
Table 1 Three manually measured spectra graphs. These provide a value for the fraction (or part) of the specific CO2 band in the total emission energy under the Ts Planck curve, taken from 0 cm-1 until 1800 cm-1. The other IR active gases and the window regions are not used in this study. The measured fraction value for CO2 is accurate enough for the purpose of this study, see the sensitivity test Table 6.
MODTRAN provides the amount of change in emission (ΔE
mission) to space for any CO2 concentration, see Table 2. Adding CO2 in the model atmosphere of MODTRAN results in additional absorption of the CO2 specific spectral lines that are emitted no longer directly from the surface to space but which
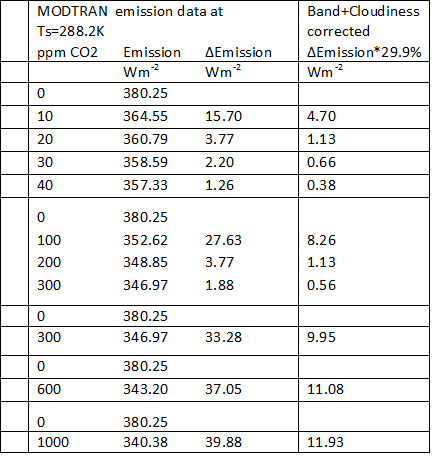
Table 2: Amount of reduced emission to space for different CO2 concentrations. For an imaginary atmosphere with no other IR active gases than CO2.
will be emitted from higher altitudes at lower temperatures (in combination with lower density and pressure) and as such the integrated energy of the total emission to space will decrease with increasing CO2 concentrations.
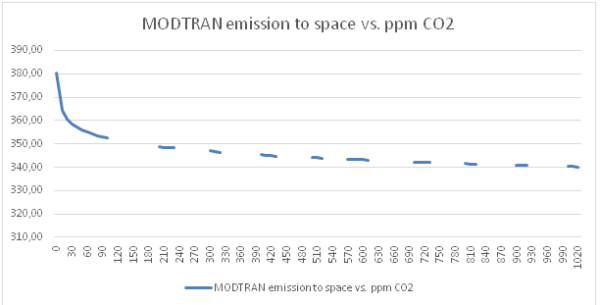
Figure 2: the exponential decrease of emissions Wm-2 with CO2 concentrations ppm. CO2 emissions as seen from looking down at 70 km. For our model atmosphere with only CO2 as the only “greenhouse gas” at surface temperature Ts=288.2K and emission values calculated by MODTRAN. The values from Table 2 are included.
The specific 614 cm-1 – 723 cm-1 CO2 15µm band
A thorough study of MODTRAN results and graphs; see Figure 3a, learns that the CO2 ΔEmission value comes from a wide range of spectral lines, much broader than the specific 614 cm-1 – 723 cm-1 CO2 15µm band, which has to be taken into consideration [i]. In the actual Earth atmosphere other IR active gases overlap on both sides of this specific CO2 band so dominantly with their emissions that CO2 concentration differences are irrelevant. This is the reason of the focus on this specific part of the CO2 band where CO2 emission and absorption has the least overlap with other IR active gases.
From manual measurements of real spectra’s and from MODTRAN generated spectra, it becomes clear that about 40% of the specific CO2 band emission originates from emission temperatures at around 220K and not much, if any, from lower temperatures. The other 60% of the specific CO2 band emission originates from higher temperatures in the troposphere as can be read from Planck curves in the spectra graphs (see Figure 3a and caption).
With increasing CO2 concentration, emission-to-space will originate from higher altitudes in the atmosphere at lower CO2 densities. This has two opposite effects for the side-bands and the central part. The side-bands emit in the troposphere where the temperature drops with higher altitudes, resulting in reduced emission. The central part emits from the lower stratosphere where the temperature increases with altitude, resulting in increased emission
Furthermore, the overall emission depends not only on the temperature but also on pressure and density and the net result found with MODTRAN is a decreasing emission. The conclusion is that the amount of ΔEmission at increased CO2 concentrations has an upper limit determined by the 60% of the CO2 emission part or 15.3%*60% of the total emission under the Planck curve of 288.2K or 34.9 Wm-2.
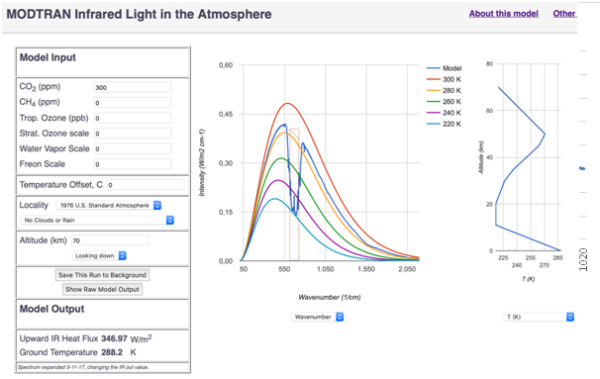
Figure 3a: Screenshot of MODTRAN for 300 ppm. The rectangle (light brown)in the wavenumber graph marks the CO2 15µm specific band between 614 cm-1 – 723 cm-1. The area within this rectangle beneath the blue 220K Planck curve is about 40% and the area above this Planck curve until the light brown tilt line just above the yellow 280K Planck curve depicts the remaining 60% area, see detail picture in Figure 3b. The total CO2 40%+60% is about 15.3% of the total area under the 288.2K Planck curve that is not shown in this picture but lies just above the yellow 280K Planck curve. The left box shows which options are chosen for model input and the calculated upward IR heat flux of 346.97 Wm-2 under the model output. At the right side, the temperature profile is given in the troposphere until 20km and the stratosphere until 70km. The Ozone layer, with the reversed temperature gradient in the stratosphere, is between 25km and 50 km.
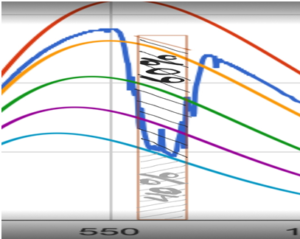
Figure3b Detail of Figure 3a. The grey shading shows the 40% area and the black shading the 60% area.
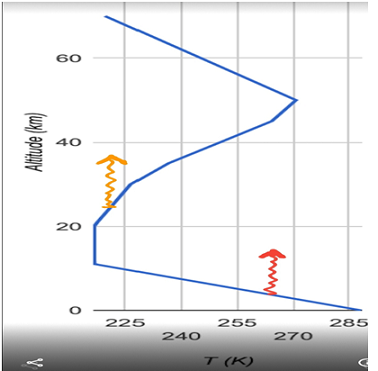
Figure 3c Temperature profile in Earth’s atmosphere with two arrows to showing the main altitude at which CO2 emits-to-space. The orange arrow to the left represents the central-band part of CO2 at low temperatures in the lower stratosphere and the red arrow to the right represents the two CO2 side-lobe-bands, which emit from the troposphere.
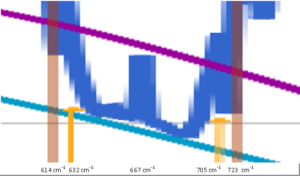
Figure 3d. Two side-lobe-bands (between the light brown bar and the yellow bar) at 614-632 cm-1 and at 705-723 cm-1. In between is the central-band with a spike (blue) at 667 cm-1 just in the center of this band. The central-band emits above the turquoise Planck curve of 222K and the small spike emits at much higher temperatures.
The calculations of MODTRAN includes emissions at wavelengths outside the specific CO2 band of interest, omitting the overlap with other emitting gasses and hence these are too high. So a correction factor C needs to be calculated.
Calculation of correction factor C
The maximum ΔEmission must be 60% of the specific CO2 band emission or maximum ΔEmission=60%*f.ɛ.σ.Te^4=29.05 W m-2 with f=15.3% and Te=288.2K, which maximum is assumed to be reached for an arbitrary 90% level at 1000 ppm CO2 with ΔEmission=39.90 W m-2. Hence 90%*29.05=C*39.9 which results in C=78.7%. Obviously, MODTRAN ignores other IR active gases other than CO2 using a CO2 band with a factor of 1.3 times wider [i].
In Table 8 MODTRAN is used to calculate this correction factor C with a different method and the same result.
This 78.7% percentage is used to correct the MODTRAN results to the calculated emissions, corresponding with the specific 614 cm-1 – 723 cm-1 CO2 15µm band. Then A further correction is necessary as clouds overrule any influence of CO2 infra-red emissions.
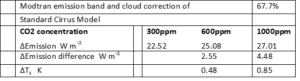
Table 3: Results corrected for the specific CO2 band and for an emission reduction by clouds. For an imaginary atmosphere with no other IR active gases than CO2.
Clouds
The former calculations assume an imaginary atmosphere limited to CO2. N2 and O2 omitting other IR active gases and clouds. Clouds do absorb most if not all infrared wavelengths; consequently, the concentration of infrared active gasses below clouds is mostly if not totally irrelevant for the emission to space. MODTRAN has an option for several different cloud models without adding H2O vapor to the atmosphere and again for an imaginary atmosphere model. In Table 7 the available cloud models in MODTRAN are listed. For example with the Standard Cirrus Model and calculated with MODTRAN, a reduction of the emission of 14% is found. In combination with the former correction factor, the necessary correction becomes 0.787*0.86=0.677 and Table 3 shows the results.
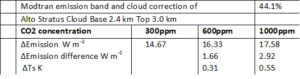
Table 4: Results corrected for the specific CO2 band and for an emission reduction by clouds. For an imaginary atmosphere with no other IR active gases than CO2.
Another example; the “Alto Stratus Cloud Base 2.4 km Top 3.0 km” a 44% lower emission is found. The new correction factor becomes 0.787*0.56=0.441 and Table 4 shows the results.
These different cloud models show that clouds have a large impact but the contribution of each model to the average global cloud cover is not clear and therefore only the global mean cloudiness will be taken into account. With the global mean cloudiness of 62% [ii] the correction factor becomes 0.787*0.38=0.299 and Table 5 shows the results
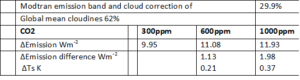
Table 5: Results corrected for the specific CO2 band and for an emission reduction by clouds. For an imaginary atmosphere with no other IR active gases than CO2.
Effects of greenhouse gasses
Table 8 shows MODTRAN results for different combination of greenhouse gases in a 1976 USA Standard atmosphere. In MODTRAN greenhouse gases Water Vapor, Freon and Stratospheric Ozone are standard scaled with altitude, Methane has a standard value of 1.7 ppm (parts per million) and Tropospheric Ozone has a standard value of 28 ppb (parts per billion).
The difference in emission-to-space between 600 ppm and 300 ppm: ΔEmission=1.13 Wm-2, which would be the resulting energy imbalance at the top of the atmosphere (TOA). If this energy imbalance was to be compensated by a higher surface temperature, the temperature increase is calculated to be: ΔTs=0.21 K.
However, in the real complex Earth atmosphere, this 1.13 Wm-2 will not directly increase the surface temperature. There are several other effects that must be taken into consideration. At first the additionally absorbed infrared will be redistributed to all available vibration/rotation/kinetic energy levels of all air molecules, according to the Boltzmann distribution law, which is valid up to 60 km altitude where collisions between molecules are fast enough [iii]. This redistribution also causes water vapor and clouds to emit part of this additional energy to space.
Then the additionally absorbed and reradiated ΔEmission in the lower troposphere causes additional water evaporation at ground level which takes up latent energy, furthermore, it steepens the temperature gradient which increases convection and condensation and cloud formation in the troposphere, releasing the latent energy again. Consequently, these processes transport the energy from the surface and lower levels aloft, compensating for the additional back radiation and thus counteracting additional warming of the surface.
Furthermore, the increased cloudiness reflects more shortwave sunlight radiation to space and emits more infrared upwards as a near black body into space. It can be concluded that these factors inhibit an increase of Ts due to a doubling of CO2 and the resulting ΔEmission of 1.13 Wm2-.
This one-dimensional model is based on global mean values and has its limitations, therefore these findings only must be regarded as a first order estimation for our complex Earth climate system.
In the former study [i] the additional absorbed energy (complementary to ΔEmission) in the atmosphere was considered to be half to be lost to space and half be absorbed at the surface, causing a temperature increase.
From these calculations based on MODTRAN it can be concluded that under global mean cloudiness 62% condition the ultimate possible contribution to an increase (ΔTs) of the global mean surface temperature Ts caused by an increase of the CO2 concentration even until 1000 ppm will not exceed 0.4 K or ΔTs<0.4 K and that there are strong indications for a ΔTs=0.
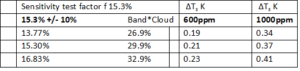
Table 6: Sensitivity test on the results of Table 5 corrected for the specific CO2 band 78.7% and for a cloudiness 62% emission reduction. For an imaginary atmosphere with no other IR active gases than CO2.
Sensitivity test
A sensible test for the factor f “CO2 band share value of 15.3” is provided for +/- 10% different values for f, see next Table 6. The values as found for the surface temperature increase does also change within 10%.
Then Table 7 shows all the cloud models as they are available in MODTRAN. Table 8 shows MODTRAN results for different combinations of greenhouse gases in a 1976 USA Standard atmosphere. In MODTRAN greenhouse gases Water Vapor, Freon and Stratospheric Ozone are standard scaled with altitude, Methane has a standard value of 1.7 ppm (parts per million) and Tropospheric Ozone has a standard value of 28 ppb parts per billion.
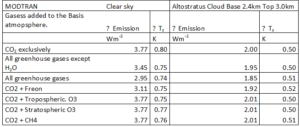
Table 8: Reduction of emission to space and corresponding increase in surface temperature Ts for combinations of greenhouse gases in a model atmosphere as facilitated in MODTRAN. This data makes it possible to calculate in a different way the correction factor necessary to restrict the MODTRAN emission output to the specific CO2 15µm band. The data within this table itself is not corrected. The correction factor to reduce the MODTRAN results to get the specific CO2 15µm band results is calculated by dividing the value for “all greenhouse gases △Emission” by the value “alone CO2 △Emission” or 2.95/3.77=0.782 which is in good agreement with the earlier found correction factor of 0.787 based on measured spectra.
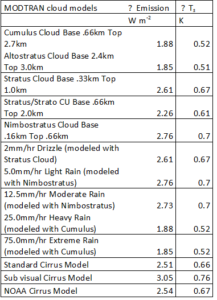
Table 7: All in MODTRAN available cloud models. Calculation of reduced emission and increase of surface temperature at doubling of CO2 concentration from 300 ppm up to 600 ppm. Not corrected for the specific CO2 15µm band.
Conclusions
Based on emission to space calculations a doubling of CO2 concentration until 600 ppm results in a surface temperature increase of ΔTs<0.21 K at most, if any. This result is consistent with to the earlier calculation of ΔTs<0.16K based on a different upper limit troposphere absorption calculation [i]. Consequently, for a first order effect –considering the complexity of the Earth system- any CO2 related surface temperature influence on today’s climate can be disregarded.
About Frans van den Beemt
Frans obtained his MSc physics in June 1973 at the University of Technology, Eindhoven, The Netherlands and his PhD in Science Studies, June 2000, University of Leiden, The Netherlands
He held positions as Teaching Assistant, University of Technology, Eindhoven, The Netherlands, then as Research Fellow, Department of Experimental Nuclear Physics, University of Technology, Eindhoven, The Netherlands. Next he was teacher in Physics and Mathematics, Eckhart College, Eindhoven, The Netherlands, System Engineer, Machines & System Group Holec, Ridderkerk, The Netherlands and Program Director, Technology Foundation STW, Utrecht, The Netherlands He is founder of consulting firm: VdBeemt 2G Advies and founder of European academia consulting firm: HandsonGrants. He authored numurous publications and performed many specialized functions.
Notes and references
[i] The physics of doubling CO2 (full version) Frans van den Beemt www.sciencetalks.nl/the-physics-of-doubling-co2-full-version/ ; Computing HITRAN data, basic global temperature increase for doubling CO2 is limited to 0.16K-0.20K
[ii] Martin Wild, Doris Folini, Christoph Schär, Norman Loeb, Ellsworth G. Dutton, and Gert König-Langlo (2013). “The global energy balance from a surface perspective.” Climate Dynamics 40 (11-12), pp. 3107–3134. DOI 10.1007/s00382-012-1569-8
[iii] R. M. Goody and Y. L. Yung, Radiation: Theoretical Basis, Oxford University Press, Oxford, UK, 1989.
[iv] [Uchicago] MODTRAN Infrared Light in the Atmosphere http://climatemodels.uchicago.edu/modtran/
[v]. [MODTRAN] http://modtran.spectral.com/ The MODTRAN® (MODerate resolution atmospheric TRANsmission) computer code is used worldwide by research scientists in government agencies, commercial organizations, and educational institutions for the prediction and analysis of optical measurements through the atmosphere.
Frans, I read with great interest your latest contribution to sciencetalks.nl.
Looking at the web interface of MODTRAN example program, I begin to understand what you are doing.
The limited contribution of the temperature increase you explain entirely by the side lobes of the IR absorption spectra near the 15 micron line, resulting in an increase of 0 to at most around 0.2 K. I understand that the side lobes are only relevant and not the central 15 micron line, but….
My question is related to an remark you made:
Quoting:
“These emissions are known as collision broadening spectra lines. Sufficient density of these multiple molecule energy states to emit to space are found near the surface in the first few km altitudes. At increasing CO2 concentrations direct emission to space takes place from some higher altitude in the troposphere at lower temperatures. ”
Strictly spoken you are right that by increasing the CO2 concentration the emissions by these collision spectra will take place at higher altitude and so at lower temperature, but is that not a bit over the top. The concentration of the CO2 molecules in the atmosphere is still so low that there will be no real shift to higher altitudes? And if there is a shift to higher altitudes, it is based on which data? Part of the MODTRAN data base?
Dear Peter van Toorn, The densities are low but just enough for an effect in the side lobs. At doubling of CO2 the shift to colder atmosphere and less emission because of lower temperatures can be seen and read from absorption spectra figures but also from the MODTRAN program.