Falsifying the supposed role of CO2 in the ice age cycles
Category: Paleoclimatology
 Abstract
In previous posts we have examined the climate/temperature mismatch between actual field exploration and the ice cores, during relatively short periods after the Last Glacial Maximum (LGM). We have concluded that the isotope paleo thermometer from the ice cores is not a direct proxy for global temperatures. It registers humidity instead. Hence, actual temperatures need to be verified from other sources in the geologic records. Here we are revisiting the relationship between solar insolation due to orbital cycles and the geologic proxies and records, focusing on MIS-3. We observe that this period is actually close to an interglacial, which is consistent with the integrated insolation records (Huybers 2006)[i]. This falsifies the Antarctic isotope records as proxy for global temperatures including the role of CO2
Samenvatting
In eerdere bijdrages hebben we de klimaat /temperatuur ‘mismatch tussen echt veldwerk en de ijskernen onderzocht, gedurende relatief korte perioden na het Last Glacial Maximum (LGM). We hebben geconcludeerd dat de isotoop paleo-thermometer uit de ijskernen afhankelijk is van luchtvochtigheid en daarom geen directe proxy kan zijn voor globale temperaturen, vandaar dat de werkelijke temperatuur regimes moeten worden geverifieerd uit andere bronnen in de geologische records. Hier bezien we de relatie tussen zonne-instraling door cyclische varieties in de baan van de aarde om de zon (Milankovitch cycles), gecorrigeerd voor de tweede wet van Kepler, en de geologische proxies en records, waarbij we focussen op MIS-3. We constateren dat de geologische records deze periode registreren als vrijwel een interglaciaal. Dit, terwijl de CO2 niveaus en de isotopen-records suggereren dat we nu juist met bijna volledige glaciale condities te maken hebben. Dit falsificeert niet alleen de Antarctische isotopenrecords als proxy voor globale temperaturen maar ook de rol die toegedacht is aan CO2 voor positieve feedback van de zonne-instraling.
Introduction
The cycles visible in the oceanic sediment cores and ice cores are believed to be caused by variation of Earths orbit around the sun, known as Milankovitch cycles. Elaboration can be found extensively. The Earth’s orbit changes from nearly circular to slightly elliptical with complex periods of 413,000 years (main period) modulated with smaller cycles of 125,000 and 95,000 years. This cycle implies variation in the distance between the Earth and the Sun throughout the yearly orbit, and hence, the amount of solar radiation (insolation). Also the obliquity, the angle between the spin axis and orbital plane wobbles slightly with a period of 41,000 years. More obliquity causes the sun to rise higher during summer, intensifying insolation. Finally, the direction of the in the Earth’s axis follows a conical cycle with a period of 26,000 years (axial precession), and the perihelium/aphelium of Earth’s orbit rotates also (apsidal precession). Both combine to a cycle of the proximity to the Sun during different astronomical seasons with a complex cycle of about 23,000 years.
Problems of the Milankovitch cycles
The Pleistocene Ice ages of the last one million year are thought to be initiated when the obliquity of the earth spin axis is most upright in combination with the sun being farthest away during northern hemisphere summer during periods of maximum eccentricity giving minimum insolation during summer. They are thought to be terminated in periods with maximum obliquity and when the sun is closest during northern hemisphere summer with maximum eccentricity, giving maximum insolation during summer. This would happen in complicated cycles of about 100,000 years.
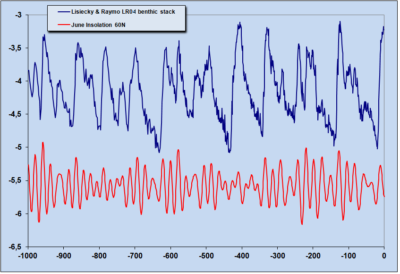
Fig 1. Oceanic δ18O data LR04 versus June Insolation 60N
However there are several problems with this hypothesis. Fig 1 shows the last million year of oceanic δ18O data Benthic Stack LR04[ii] which is thought to represent total ice volume on Earth against the June Milankovitch insolation at the latitude of 60 North. Obviously the 100,000 year cycle visible in the oceanic δ18O data is not apparent in the insolation data.
Fig 2 Complete Benthic stack LR04 (Lisiecky & Raymo 2005)
Furthermore, when insolation variation is at a minimum around 400,000 years ago, we see a strong δ18O variation in the oceanic data. Another problem is the period before this,where the dominant cycle in the oceanic data appeared to be 41,000 years (fig 2).
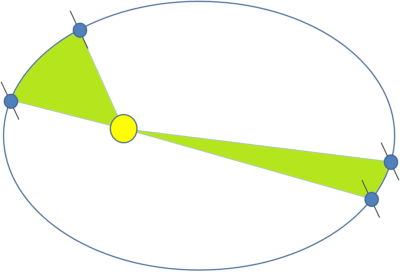
fig 3. Kepler 2nd law of planetary motion. A line segment joining a planet and the Sun sweeps out equal areas during equal intervals of time If the two green areas are equal, the orbit velocity of the planet is higher when closer to the sun.
Yet another problem is that the Milankovitch insolation calculations are usually only an annual snapshot, taken at summer solstice in June. This disregards annual variation in the earths orbit due to velocity variation caused by gravity as in Keplers second law of planetary motion. It states that equal areas between the planet and the sun are covered in equal time (fig 3). Therefore, if the earth is closest to the sun during northern hemisphere summer, it also moves faster, making the duration of the summer shorter. Obviously those effects oppose each other. Therefore looking only at insolation during summer solstice is disregarding the total insolation during summer. Hence the total (integrated) amounts of summer insolation in both cases are much closer to each other than the customary single summer solstice snapshot would suggest. Evidently if the effect of the precession cycle opposes the effect of the eccentricity cycle, yhen it would leave the obliquity cycle of 41,000 years as the most important cycle dominating climate. This would supports the findings of the oceanic δ18O records as in the LR04 stack before one million years ago.
Integrated Summer Insolation and MIS 3
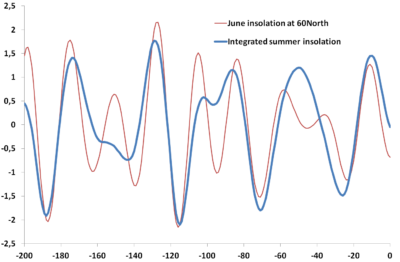
Fig 4 Huybers Integrated Summer insolation vs June summer solstice insolation at 60N
Huybers 2006[i] calculated the integrated summer insolation for the last two million years. and we compare the last 200,000 years in fig4 on normalized scales. (blue graph),to the original Milankovitch data for the June insolation at 60 degrees North in the red graph. Apparently the higher frequency effects of the precession cycle are somewhat suppressed and the main frequency that emerges appears to be close to 41,000 years.
Next in fig 5 we compare the integrated insolation in red with Antarctic ice core data of the last 150,000, to includes the penultimate Interglacial
the Eemian on normalized scales. The Marine Isotope Stages (MIS) on the time axis are in accordance with the definition of Lisiecky and Raymo 2005
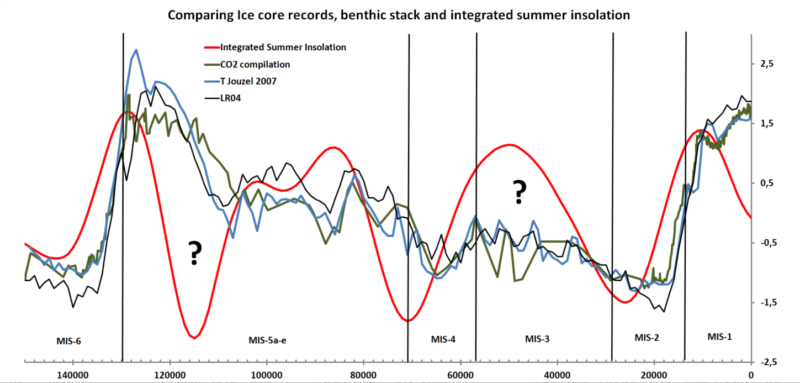
Fig 5 Comparing CO2, isotopes and insolation
In blue we have the isotope global temperature reconstruction of the EPICA Dome C ice cores (Jouzel 2007[iii] ) in increments of 1000 years averages, and in green the CO2 concentration from several sources. We note the striking similarity of both to the reversed benthic stack isotope data in black. This will be subject of a next contribution.
Then, although the original Milankovitch insolation data (faint grey dashed line) appear to resemble the ice core data and oceanic stack data somewhat, the discrepancies are much more evident for the integrated summer insolation in red.
Especially the spike at about 50,000 years in MIS-3 is well above the average value, and obviously a mismatch for the CO2 and isotope thermometers, being clearly below the average value, whilst approaching the minima of the Last Glacial Maximum (MIS-2). Hence we must focus on this period to test whether the integrated summer insolation is controlling climate or if the isotopes proxies are an accurate representation of the climate. So how cold or how warm was MIS-3 actually?
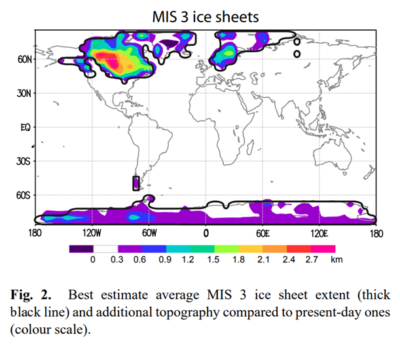
Fig 6 Van Meerbeeck et al 2006 Ice sheet modeling.
The Mystery of MIS-3
As LR04 suggest a substantial ice volume, we focus first on ice volume models for MIS-3 . Van Meerbeeck 2009[iv] gives an overview of the ice sheet extent based on modeling (fig 6). The best estimate for the average ice sheet map they reconstruct is interesting (their fig 2 with original caption). For unknown reasons they did not seem to have verified this. Take for instance their ice dome on Svalbard, north of Scandinavia compared to the findings of Mangerud 1992[v] who concluded from their fieldwork that “during the ice-free period preceding that glaciation (LGM), at least back to 40,000 yr B.P., the glaciers on Svalbard were not significantly larger than at present,..“. Also consider the large, about 1.5 km high ice dome covering Scandinavia completely, compare this to the ice free conditions for MIS-3 as found by Helmens[vi] earlier.
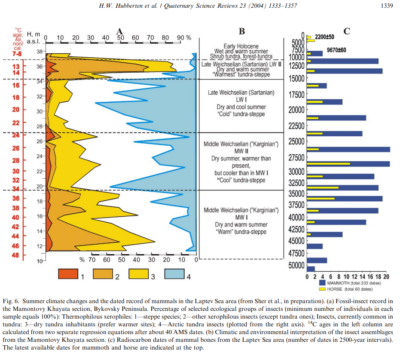
Fig 7 Hubberten 2004
Actually Sarala 2016[vii] claims temperatures higher than today for Finnish Lapland. For Siberia Hubberten 2004[viii] (fig 7) present a fossil insect assemblage, showing a period warmer than today in the Middle Weichselian (“Karginian”, MW1) between 48,000 and 34,000 carbon dated years (>50,000 – 38,500 calendar years), covering MIS-3. Then for China warm conditions for MIS-3 are reported by Zao 2017[ix] and Yang 2004[x]. Next for Europe Germany, the Eifel area, Sirocko 2016[xi] find “most unexpected, but corroborated by all our maar records is the dominance of thermophilous tree taxa from 49 000 – 55 000 b2k (LEZ 8)”
Then the America’s, In Alaska, the abundance of megafauna appears to have been higher in the period 45,000 to 30,000 years ago than it was in later periods Mann 2015 (fig 4)[xii] albeit that several fluctuations are visible, which may correlate to the Dansgaard Oeschger events. Also Kuzmina 2017[xiii] finds a distinct warm period before the last glacial maximum but is unsure about the dating being MIS-3 or MIS-5. Interesting is the find of galls from cynipine wasps in Southern Californa in the La brea tar pits (Holden 2015)[xiv] , suggesting that the ecological conditions and climate between 33,000 and 44,000 years were the same as today.
In the southern hemisphere records of MIS-3 are less obvious, which is to be expected, considering that the MIS-3 spike in fig 5 is about a generally cooler but longer northern hemisphere summer. Thackray 2017[xv] records large large glaciations at late MIS2, and the MIS 3-2 transition.
We can conclude from field work about MIS-3 that it was relatively warm in the Eurasian area as well as in Southern USA. The northern part of America (Alaska, Yukon) is less obvious as is the southern hemisphere, which is to be expected. But the overall result clearly points towards a relatively warm environment whereas the isotope based models require significant ice sheets and approaching near full glacial conditions. Hence the isotope proxy interpretations can be considered falsified.
Conclusion.
The integrated northern hemisphere summer insolation has a dominant 41,000 cycle whereas the ice cores and benthic stack display a dominant 100,000 cycle for the last one million years. One of the time frames with significant difference is MIS-3, where the integrated summer insolation is strong, but the Antarctic and oceanic isotope proxies as well as the CO2 concentration suggest a near ice age maximum. However multiple other geologic and paleo-biologic records clearly indicate MIS-3 as a distinct warm period even with near minimum CO2 levels and near minimum isotope temperature proxy interpretations. This would confirm the dominance of the integrated insolation of the northern hemisphere to climate and it would falsify the hypotheses of the ice core isotopes in precipitation and the isotopes of oceanic foraminifera cores to be accurate representations of the climate of the past. It would also falsify the notion of positive feedback CO2 to enhance temperature swings due to insolation cycles.
Notes and references
[i] Huybers, Peter J. 2006. Early Pleistocene glacial cycles and the integrated summer insolation forcing. Science 313(5786): 508-511.
[ii] Lisiecki, L. E., and M. E. Raymo (2005), A Pliocene-Pleistocene stack of 57 globally distributed benthic d18O records, Paleoceanography, 20, PA1003, doi:10.1029/2004PA001071
[iii] Jouzel, J., et al (32 authors) 2007. Orbital and Millennial Antarctic Climate Variability over the Past 800,000 Years. Science, Vol. 317, No. 5839, pp.793-797, 10 August 2007.
[iv] Van Meerbeeck, C. J., Renssen, H., Roche, D. M., Wohlfarth, B., Bohncke, S. J. P., Bos, J. A. A., S. Engels, K.F. Helmens, M.F. Sánchez-Goñi, A. Svensson, Vandenberghe, J. (2011). The nature of MIS 3 stadial–interstadial transitions in Europe: New insights from model–data comparisons. Quaternary Science Reviews, 30(25-26), 3618–3637. doi:10.1016/j.quascirev.2011.08.002
[v] Mangerud, J., Bolstad, M., Elgers, A., Helliksen, D., Landvik, J.Y., Lønne, I., Lycke, A.K., Salvigsen, o., Sandahl, T., Svendsen, J.I. 1992 The last glacial maximum on Spitsbergen, Svalbard Quaternary Research, Volume 38, Issue 1, July 1992, Pages 1-31
[vi] Helmens, K.F., P.W. Johansson, M.E. Räsänen, H.Alexanderson, K.O. Eskola, 2007. Ice-free intervals continuing into Marine Isotope Stage 3 at Sokli in the central area of the Fennoscandian glaciations, Bulletin of the Geological Society of Finland, Vol. 79, 2007, pp. 17–39
[vii] Sarala P,. Väliranta M., Eskola T., Vaikutiené G ,. 2016 First physical evidence for forested environment in the Arctic during MIS 3 Sci Rep. 2016; 6: 29054.
[viii] Hubberten et al (21 authors) 2004. The periglacial climate and environment in northern Eurasia during the Last Glaciation. Quaternary Science Reviews 23 (2004) 1333–1357
[ix] Zhao, Y., An, C.-B., Duan, F., Zhao, J., Mao, L., Zhou, A., Cao, Z., Chen, F. (2017). Consistent vegetation and climate deterioration from early to late MIS3 revealed by multi-proxies (mainly pollen data) in north-west China. Review of Palaeobotany and Palynology, 244, 43–53. doi:10.1016/j.revpalbo.2017.04.010
[x] Yang G, B., Shi, Y., Braeuning, A., & Wang, J. (2004). Evidence for a warm-humid climate in arid northwestern China during 40?30ka BP. Quaternary Science Reviews, 23(23-24), 2537–2548. doi:10.1016/j.quascirev.2004.06.010
[xi] Sirocko, F., Knapp, H., Dreher, F., Förster, M. W., Albert, J., Brunck, H., D. Veres, S. Dietrich, M. Zech, U. Hambach, M. R ¨ohner, S. Rudert, K. Schwibus, C. Adams, Sigl, P. (2016). The ELSA-Vegetation-Stack: Reconstruction of Landscape Evolution Zones (LEZ) from laminated Eifel maar sediments of the last 60,000 years. Global and Planetary Change, 142, 108–135. doi:10.1016/j.gloplacha.2016.03.005
[xii] Mann, D. H., Groves, P., Reanier, R. E., Gaglioti, B. V., Kunz, M. L., & Shapiro, B. (2015). Life and extinction of megafauna in the ice-age Arctic. Proceedings of the National Academy of Sciences, 112(46), 14301–14306. doi:10.1073/pnas.1516573112
[xiii] Kuzmina, S., Froese, D. G., Jensen, B. J. L., Hall, E., & Zazula, G. D. (2014). Middle Pleistocene (MIS 7) to Holocene fossil insect assemblages from the Old Crow basin, northern Yukon, Canada. Quaternary International, 341, 216–242. doi:10.1016/j.quaint.2013.10.025
[xiv] Holden A.R., Erwin D.M., Schick K.N., Joyce Gross J. (2015). Late Pleistocene galls from the La Brea Tar Pits and their implications for cynipine wasp and native plant distribution in southern California. Quaternary Research, 2015; DOI: 10.1016/j.yqres.2015.09.008
[xv] Thackray G.D., Shulmeister, J. Hyatt, O.M., Wang, N., Rieser, U, 2017. MIS 3 glaciation in the middle Rakaia valley, New Zealand, documented through stratigraphy and luminescence geochronology. July 2017 New Zealand Journal of Geology and Geophysics 60(4):1-13 DOI: 10.1080/00288306.2017.1342664
Update 29/2: A new fig 5, Corrected Normalizing.
André,
Thank you for your interesting article.
Although I agree that δ18O is sensitive to humidity, I doubt that MIS 3 can be considered as distinct interglacial.
For that period I would consider CO₂ from the Vostok ice core as a reliable temperature proxy.
Moreover there are other proxies that agree with CO₂ and
δ18O from the LR04 benthic stack or the Vostok ice core:
Alkenone UK’37 and Mg/Ca from G. sacculifer agree also.
About glacial termination, tzedakis et al. showed that caloric half-year summer insolation and time determines glaciation. Glacial inception corresponds well with decreasing obliquity.
http://eprints.esc.cam.ac.uk/3856/1/nature21364.pdf
https://m.imgur.com/fI1uUqZ
https://dspace.lafayette.edu/bitstream/handle/10385/542/Lawrence-Science-vol312-no.5770-2006.pdf?sequence=1
http://euanmearns.com/the-vostok-ice-core-and-the-14000-year-co2-time-lag/
Thanks for the information, Dirk
There will be a next contribution soon (trying next week) where we will address the oceanic source proxies, which we haven’t done so far. There is plenty more to go. Then we will see, who can explain best most/all phenomena in this dispute.
Spoilers:
http://science.sciencemag.org/content/316/5830/1456
https://www.sciencedirect.com/science/article/pii/0377839896000035